Evaluating the Effectiveness of Your Sales Compensation Plan
When it's time to make a change...

If you’ve been a visitor on to my site for any length of time, you’ll know how I feel about a sales compensation plan: it’s a document designed for a moment in time. What it does for you today, it may not do tomorrow. So, it’s important to regularly evaluate your compensation plan.
Ideally, for organizations with sales teams, there is a governance committee in charge of managing the sales compensation program. This committee may meet quarterly or at the end of each performance period. But each time they meet, it’s important to plot the results of the sales team on the pay curve.
Using the Pay Curve to Identify Performance Results
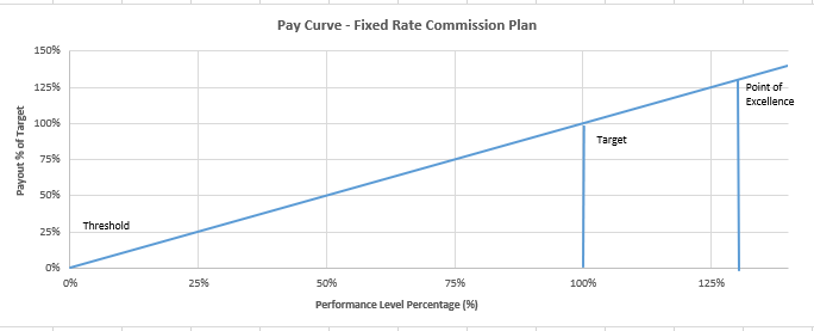
Your pay curve is a graph similar to the one below that maps things like:
- Threshold: the point at which pay for performance starts. The threshold point sits somewhere between 0% and 100%, and it can be zero, which essentially means there is no threshold. And it’s okay if your organization doesn’t have one!
- Target: the point on the pay curve that represents 100% payout and 100% performance.
- Point of Excellence: the point on the pay curve that represents the 90th percentile of salespersons’ performance levels.
On the chart below, you’ll see that the pay curve is a straight line (slope of 1). It becomes more of a distinctive curve when you add accelerators or decelerators into the mix, but that’s a subject for another time.
Once your salespeople have completed a performance period, it’s time to plot them each on this chart.
The x-axis represents the percentage of performance against the target. The y-axis represents the payout as a % of the target incentive amount. An example would be 70% of the quota achieved in Q1 and 70% of the target incentive achieved.

Ideally, you’ll have charts for past performance periods as well, and you can build on and compare to over time. And in a perfect world, those dots will usually be clustered near the target point with one or two on the lower and upper end – meaning nearly everyone is hitting target levels (and being paid out proportionally). .
Spotting a Single Low Performer
If you’re seeing consistent clustering along the pay curve, but one point is dramatically over or under the target, you may have a problem, or you may have a one-time aberration. This is where past data comes in handy.
For the dramatic underperformer: If your salesperson is typically at target but just failed to perform this period, it’s worth checking in on them just to make sure they’re doing okay and have everything they need. Perhaps they didn’t meet the threshold and didn’t receive any payout. There are any number of reasons a person might have had an “off” sales period.
However, if they are consistently under target for the past few data cycles, then they likely need either some training or a new position. The key is to not jump to any conclusions but rather investigate.
Remember: mapping salespeople on the pay curve chart is only there to give you an idea of when problems may exist. It doesn’t tell you what the problems are. That requires investigation.
For the dramatic overperformer: Again, a one-off occurrence may not be a big deal. Maybe they just crushed it this period. Maybe they took advantage of a special incentive that took them off the normal pay curve. However, if your overperformer is consistently massively overperforming, it might be a good idea to assess the opportunity in their territory for clues as to why they are able to achieve so much more than the others proportionally.
Spotting an Equity Problem
Fairness in a compensation program that relies exclusively on pay for performance is challenging, but that’s why I recommend plotting the sales performance against the targeted pay curve chart as a quick view of how things are falling out among your sales team.
One scenario that sometimes occurs is two clusters with a large divide, one earning target or higher, one earning significantly less. This might be categorized as a bimodal distribution (Google it!). Again, if past data is available, you can use it to identify trends versus flukes.
If you notice there’s a group that is consistently underperforming, it’s time to look at a few things.
- Plot again, taking into account race, age, or gender categories. Is there a significant difference in performance or payout amongst any one subgroup in relation to the total sales team? Inequity can sometimes occur when an implicit bias has influenced the way the compensation program was implemented.
- Take a look at your individual salesperson’s individual opportunity assessment. This would be the total market value available for them to sell into locally. Perhaps, whether through poor interpretations of data or changes in culture, the opportunity hasn’t been divided equitably among the sales team.
- Analyze territorial lines (whether geographic or assigned accounts) for the same reason as mentioned with opportunity.
- Most importantly, interview your sales team, as they will likely have the most valuable insight into the situation.
Once you’ve identified the problem, it’s easy to take steps to correct it.
The important thing to remember is that sales compensation programs are never going to be perfect, not for more than a moment anyway. And making adjustments along the way is just par for the course. It is important to get comfortable with the ongoing change and evolution of the program in hopes of continual improvement.


